
ultradata: part 1
In addition to being a data scientist, I’m also a runner. in the last few years I’ve focused on ultramarathons, which are anything over the 26.2 miles of a standard marathon and almost always done on trails in the mountains. Honestly it’s an elaborate excuse to spend long hours in the woods and eat alot of junk I don’t normally eat. My goal is to one day run the Hardrock 100, and towards that goal I’m going to do the Grindstone 100 in October as my first 100-miler. As a disclaimer, I’m a pretty mediocre runner. “front-of-the-middle” is where I normally hope to finish– I didn’t run a 2:20 marathon in college and I’m never going to win an organized foot race. This is all purely fun and personal goals setting.
As you might imagine, preparing to run 100 miles involves running quite a bit. I record all my runs using a GPS watch and Strava. Strava has a great interface and nice tools to track your training calendar and training progression. It just works and makes run tracking seamless and easy. Highly recommended. And now that I’ve been running for years on Strava I have quite a nice dataset accumulated of run performances in both training and racing.
Shame to let such a dataset go to waste.
the goal
My goal is to analyze my running data and develop a model to predict my performance. Specifically since I haven’t taken the time to harvest truly big data from a platform yet, I’m only modeling my own running. In another scenario which maybe we’ll get to, I’d integrate data from many, many runners and probably come up with a much more robust, better model to generically predict run-performance. Feel free to send me your strava files! but for now, let’s make this about me and how I tend to perform given previous days running and the challenge of a given mileage/elevation gain/etc.
the data
Starting middle of 2016, I have 503 activities recorded. The vast majority of these are training runs, a few are races, and a few are quite large hybrid hike/runs. The good folks at Strava allow you to download all your activity files in a big batch as .fit files, and luckily there’s a Python library (fitparse) that parses .fit files. I wrote a quick script to extract each activity as a series of datapoints per activity. Each datapoint gives a distance, time, altitude, gps coordinates, and anything else my watch was recording at the time. This gives me a very detailed look at each activity at essentially a ~10-20 meter resolution. But for now, I want to take a step back and look more globally at the data just to begin getting a sense of it.
On average:
- 9.07 minutes/mile (+/- 2.07 std)
- 6.73 miles/activity
- 66.0 minutes/activity
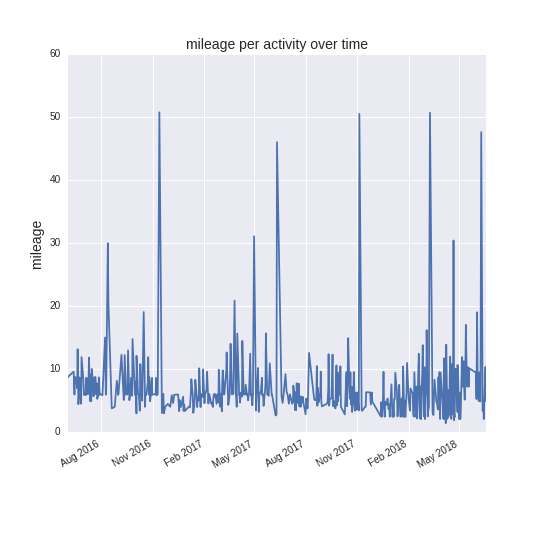
Simply plotting the total mileage of each activity over time shows several neat features. The GPS tracks usually end near 50 miles, reflecting the fact that most of my ultras have been 50-milers. Also my GPS watch usually runs out of battery at this point which is a fortunate coincidence. You can also notice the periodicity in my training calendar– on the yearly cycle there is a lull in the deep winter months where I take time off from directed training. At smaller timescales, you can see the periodic spiking in mileages that tend to build towards the very large spikes (races). This reflects my usual pattern of doing progressively longer runs once per week as I build towards race events.
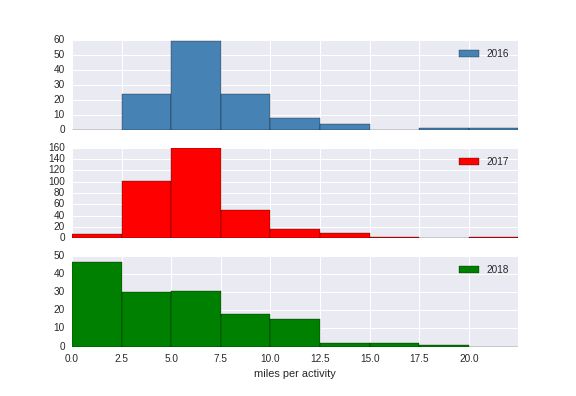
I decompose mileage over time into a histogram divided per each year (middle 2016-middle 2018). The y-values on the vertical axis of each are misleading because 2017 has a full year of data whereas 2016 and 2018 only have half year. The actual counts are important though, just the shape of the histograms. 2016-17 look fairly similar, with most training runs right in the average range of 5-7.5 miles. Note in 2018 the curve has broadened considerably.
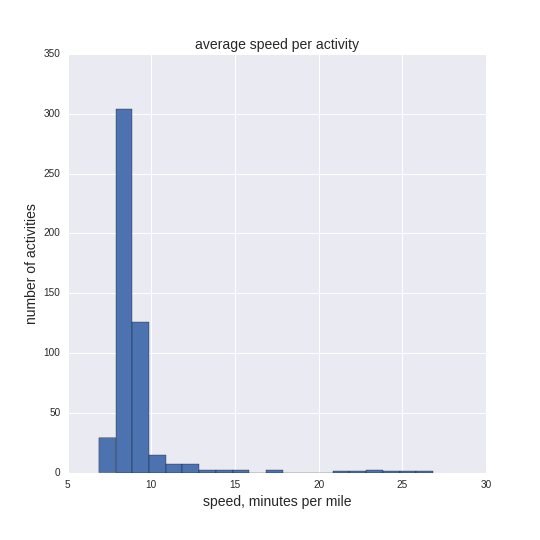
A histogram of average speed per activity shows the fairly narrow window where most of my training happens. At the far right around 25 are the walking paces that often accompany hikes or later efforts in ultramarathons when the going gets tough.
next steps
For the next installment of this series, I am going to take a deeper dive into each activity and begin the setup for modeling performance over an activity. First I want to assess how much variance there is in running performance and how much is explainable by the data I have available here. I also want to begin comparing activities and estimate how many underlying performance models are appropriate to capture the explainable variance.