
Analyzing EDGAR
The Electronic Data Gathering, Analysis, and Retrieval (EDGAR) system is where the Securities and Exchange commission collects and validates forms that companies and individuals are required to submit about their financial happenings. Amongst these forms are Form 4, wherein company insiders must disclose when they are buying or selling stock. EDGAR made news not so long ago (August 2017) when SEC reported that it was hacked and information was possibly used for illegal trading purposes. Given the latest news it was probably the cyber army of North Korea…who knows.
Around the same time I stumbled across this article on Investopedia. Keeping track of insider buying is a well-acknowledged trading strategy. Insiders might sell stock for any number of reasons but they’re unlikely to buy unless they think the stock will rise. Obviously this isn’t a novel idea, and there are whole (paid) websites that provide investors with reports on insider buying. But I wanted to test this idea out– get some data and examine if I were to create a bot that auto-traded upon getting info on insider buying, could that bot beat the market?
Because I’m cheap and this is just a lark, I didn’t buy data from Forbes. Instead I kludged together a simple web-scraper to pull Form4 data right off EDGAR’s website and let this script run in crontab on my laptop for a couple months. Then I looked at the transactions. From Sept 11 2017 to Dec 20 2017 I recorded 22510 Form4 filings from the EDGAR site. This is not comprehensive because I wasn’t constantly hitting refresh on the website to check for more forms– there may have been far more filings.
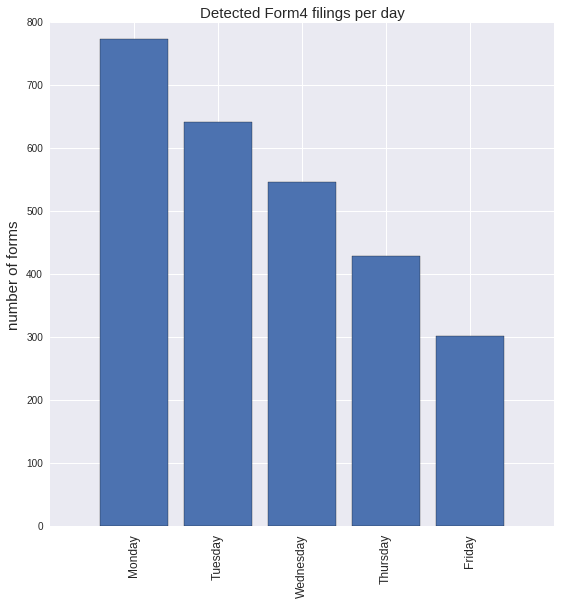
If we examine the days of the week on which filings occurred, we find filers really hit it hard early in the week. Forms detected peaks on Monday and slowly decays through the week. The caveat to this is maybe late-filings or weekend filings add up and accumulate on Monday.
Figure 1.
Next I get into it– can a bot based on this thing make some cash?! I look in each form and detect the ticker being bought. Then I get the price of that stock (relative to the market, which here I take as NASDAQ) and look at three timescales after the Form hits EDGAR: 1 day, 1 week, and 1 month. Figure 2 asks the question: if you bought and held the stock mentioned in the EDGAR Form for those time periods, does the price reliably go up? Investopedia leads us to believe that it should be on the upswing.
Figure 2.
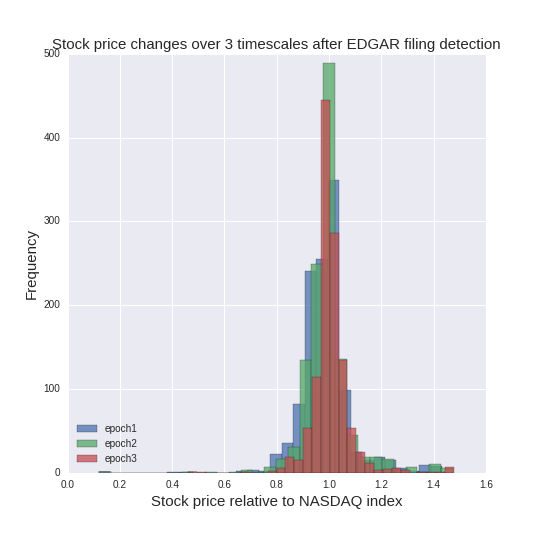
The answer is on average stocks from the EDGAR filings do not go up after the form is filed. At 1 day or 1 week, in fact, they tend to go down (shown by both the mean price change and the tendency of the histogram below 1 in Figure 2). At 1 month, prices tend to equal out. On average there’s no change, but certainly from the histogram we can see that some stocks do go up relative to the date the Form4 is filed. If we knew which stocks those were, I suppose we could make some money.
That result was unexpected, though not from an efficient market perspective. My scraping of the EDGAR filings was crude at best, and I suspect there are high-frequency and automated trading algorithms that are harvesting this data and acting on it at much more rapid timescale than I’m looking. Perhaps if I examined much finer scale pricing data you’d see an uptick in intraday price of the stock around when the form is filed. Based on the hypothesis that perhaps bots are actively trading in this space, I wanted to look for evidence of that by simply examining the volume of trading on the day of EDGAR form-filings.
Figure 3.
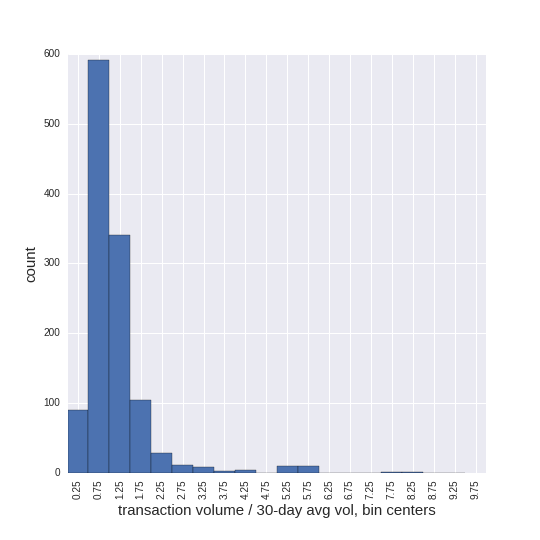
Figure 3 shows the volume analysis: a histogram of the ratio of volume on filing day (‘transaction volume’) to the 30-day average volume preceeding the filing. The histogram is centered right below 1 actually, immediately suggesting that volume on the day of filing is actually lower than average for a particular stock. There are notable outliers– the blip in the histogram out around 5 might suggest enhanced (strongly) trading activity on the day of filing. And indeed the average of all these values is slightly above 1, suggesting that on average, trading volume on filing day does exceed 30-day average for that stock. The deviations are likely small, and a better statistical analysis would undoubtedly be needed to determine if these deviations are statistically significant.
Overall though, we’ve learned something about EDGAR filings, but more importantly, we’ve seen its pretty difficult to beat the market. As everyone says.