heart rate variability (HRV) and running data
In this small project, I integrate my Strava data and heart rate variability (HRV) data collected using the EliteHRV app. Strava is a website where you can upload GPS tracks of athletics– running, cycling,swimming, whatever, recorded on GPS watches or smartphones. EliteHRV is an app that uses a heart rate (HR) strap monitor to measure the variability between heart beats as a metric of sympathetic and parasympathetic nervous system engagement. Supposedly this reports on stress/restfulness in your life. Anecdotally I noticed that my HRV stats did not seem to strongly correlate with my subjective feelings of physical fatigue and running workload, but I wanted to quantitatively assess this using my data! You’ll see below that the data does seem to support this hypothesis. I suspect, for me anyway, my HRV data correlates much more strongly with mental and emotional stress and not physical endurance training stressors. As soon as I find a method or app to quantify my emotional stress, I’ll do the analysis!
The main content of the code is two functions that parse GPX (Strava) data and the HRV data. I use the GPXPY library to parse GPX files to extract time duration of the workout, length in miles, average pace, and elevation changes. This function has arguments that set the time range over which to extract GPX files, to match the time range of when I have been collecting HRV data. The HRV function reads over a directory containing text files that contain the HRV data. The function extracts a variety of HRV parameters from this: beats/minute, root mean square deviation of time between beats, standard deviation of time between beats, the average time between beats, and others. Its not clear to me there is a consensus about which of these HRV stats is the most meaningful.
Most of the rest of the code is time-aligning and arranging endurance versus HRV parameters for statistical tests.
First I look forward from each endurance activity and extract HRV parameters one and two days post activity. The hypothesis is that if endurance affects stress levels, and HRV measures this, I should detect correlations (positive or negative) in the HRV parameters post-activity. The plots below show the correlation coefficient between each endurance parameter (x-axis) and each HRV parameter (colored bars). At one day, the correlations are not very strong and mostly centered around zero. Note that pace and beats/mtrava and EliteHRV both allow you to download all of your data, so kudos to them.inute seem to correlation fairly strongly– suggesting that the faster I ran the day before, the higher my resting heartrate was the next day. Interestingly, at two days post activity (right plot), there are stronger correlations with both pace and duration.
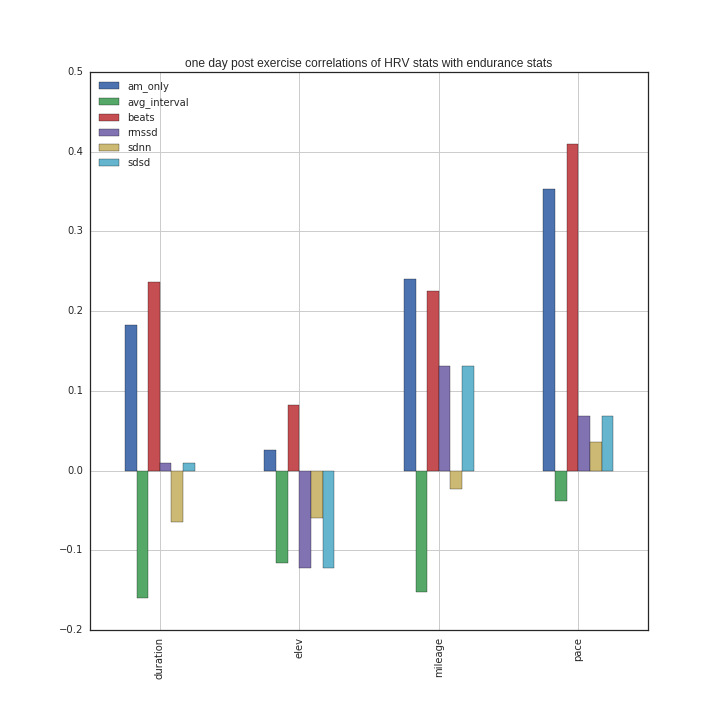
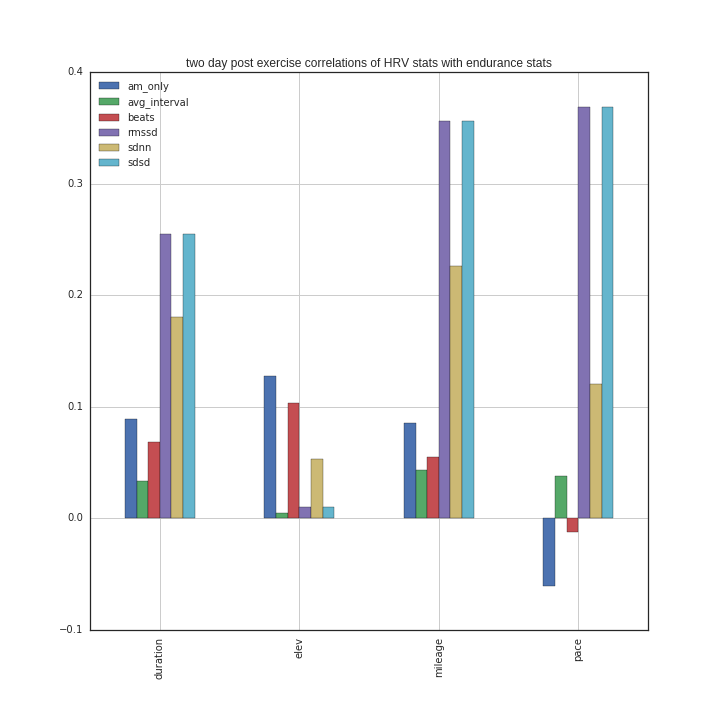
This finding was slightly surprising to me, especially that my two-day post-activity HRV stats should correlate with workout intensity. It’s possible this is an artifact of my training schedule, which is pretty structured such that I hit rest days reproducibly two days post intense training.
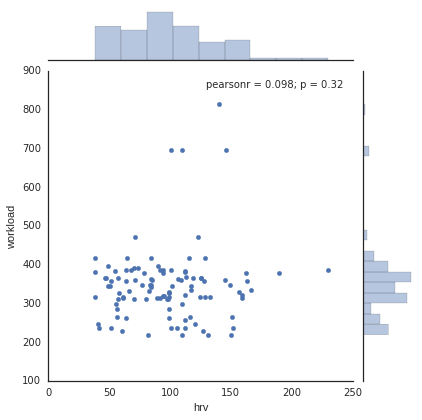
I also analyzed the data in a somewhat opposite way, looking backwards from each HRV parameter reading and calculating the total training load (just summed duration or mileage) for seven days prior. This more directly tests my initial hypothesis that my HRV stats didn’t appear tocorrelate with my subjective feelings of training load. Indeed, when I scatter plot HRV parameters (here the RMSSD) with total training load 7 days prior to each (total duration), there isn’t a meaningful correlation in the data (correlation coefficient <0.1). This low correlation was robust across each of the HRV and endurance parameters I used. Qualitatively you can readily see in the scatter plot that my hypotheis of low correlatiYou can see in the scatter plot that my hypothesis of low correation is true on between HRV stats and training load holds. Across the range of workload amounts, the HRV data is scattered all over the place.