ajt_3000
I am a cellular biophysicist. The type of work that I do involves alot of microscopy– so my lab has implemented a fairly rigorous file naming and annotation scheme to keep track of all the images and movies we generate while imaging living cells. the scheme names each movie or image by the microscopist’s initials followed by a number. I recently hit AJT_3000 (and got further recently) and so I wrote a silly little script to roll over my imaging log book and extract some statistics.
Starting in the fall of 2013:
- percent of weeks I recorded at least one image= 85%
- average acquisitins per day of imaging= 12.7
- average acquisitions per total days =3.24
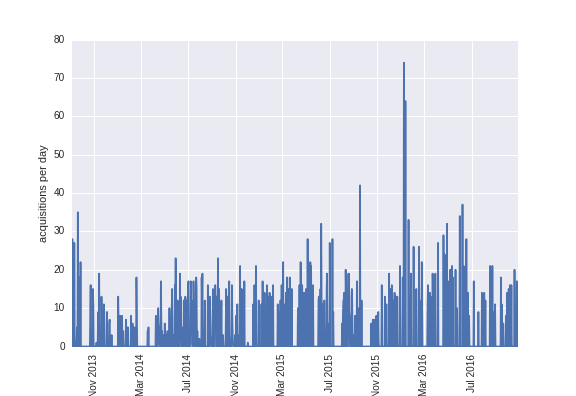
Plot of acquisitions per day.
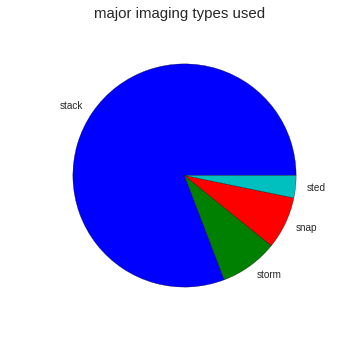
Scientists in my field, well, at least me, get weirdly excited about using pie graphs. Its not a plot we actually use to show data very often, but its a graph that almost everyone is familiar with. So, here’s a pie of the breakdown of the major types of imaging I do. “stack” is a movie, usually about 250 frames long. STED and STORM are super-resolution fluorescence microscopy techniques. SNAPs are just single images.